
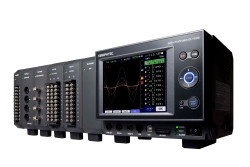
The Graphtec GL7000 is a modular Data Acquisition platform that can be configured to suit individual applications with a range of input modules that are easy to set up and operate.
Main control module The GL7000 main control module is at the heart of this flexible yet powerful data recording system and provides the core functionality which includes USB and Ethernet ports for PC connection, remote or local touch screen display, Internal Flash data storage, SD card for removable data storage and connection to 10 additional input modules .
Touch screen display The optional touch screen display which utilises a bright clear 5.7 inch colour LCD monitor can easily be fitted directly to the main control unit or used remotely via a standard LAN cable. The LCD monitor makes it easy to read recorded data in wave form or digital data and to check measurement parameter settings, but enables the system to be completely stand-alone from a computer.
Input/Output Amplifiers Various input amplifiers modules can be added as required by the data recording application. THe current range of input amplifiers include; Voltage, Voltage/temperature, High-speed voltage, Logic/pulse, Analog voltage output, Strain Gauges and TED sensors, Charge/Acceleration. Full details for the GL7000 amplifiers.
SSD memory module An optional SSD (Solid State Disk) module with 64GB memory is available for added data storage and allows for large amounts of data to be quickly saved when the sampling is not faster than 1µs. The SSD has a high vibration resistance and any saved data is also retained even when power is turned off.
Software Graphtec's GL-Connection software for the GL7000 is freely supplied and no further additional licensing cost are required. GL-Connection software highlights.
- Configure the measurement channels
- Monitor real-time data measurements
- Save data directly to PC
- Replay captured data
- Convert data to CSV format for MS Excel analysis
- Display data in Y-T format or X-Y format
- Statistical Calculation max, min, peak, ave
- Send e-mail for Alarm warnings